


Key Highlights
Monitoring the health of cloud applications is crucial for ensuring optimal performance and user experience.
Response time, error rate, traffic, resource utilization, and user satisfaction are the top metrics to monitor for cloud application health.
These metrics provide insights into the performance, efficiency, and user experience of cloud applications.
Cloud monitoring tools and techniques, such as real-time monitoring tools, log analysis, and AI-based predictive monitoring, can help in effective cloud application monitoring.
Best practices for cloud application health monitoring include establishing KPIs, regularly reviewing and adjusting thresholds, fostering a culture of continuous improvement, and leveraging community knowledge and resources.
Introduction to Cloud Application Monitoring
Cloud applications have become an integral part of modern business operations. With the rapid adoption of cloud computing, organizations are leveraging cloud services to build and deploy scalable and flexible applications. However, ensuring the health and performance of these cloud applications is essential for delivering a seamless user experience and achieving business objectives.
Monitoring the health of cloud applications involves tracking various performance metrics to identify any issues and take proactive measures to maintain optimal performance. Cloud application monitoring involves monitoring response time, error rate, traffic, and resource utilization. These metrics provide insights into the performance, efficiency, and user experience of cloud applications.
In this blog, we will explore the top 5 metrics to monitor for cloud application health and discuss the importance of each metric in ensuring the optimal performance of cloud applications. We will also dive deeper into the understanding of cloud application metrics, the tools and techniques for effective cloud application monitoring, and the best practices for monitoring the health of cloud applications.
By monitoring these metrics and following best practices, your organization can proactively detect and resolve issues, optimize resource utilization, and continuously improve the performance and user experience of your cloud applications.
Understanding the Importance of Monitoring Cloud Applications Health
Cloud application monitoring involves proactively tracking various key metrics to identify and address potential issues before they significantly impact user experience or business operations. Here's a deeper dive into why proactive monitoring is crucial:
What is the Significance of Proactive Monitoring?
Reactive approaches, where you wait for problems to manifest before taking action, are risky. By the time issues become apparent, they might have already caused downtime, data loss, or frustrated users. Proactive cloud application monitoring allows you to:
Identify Performance Bottlenecks: Before issues snowball, proactive monitoring helps pinpoint areas where your application is sluggish or inefficient. This enables you to optimize resources and improve overall performance.
Prevent Downtime: By identifying potential problems early on, you can take corrective actions to prevent outages entirely. This ensures uninterrupted service delivery and a positive user experience.
Enhance Scalability: Monitoring resource utilization helps you understand your application's scaling needs. By proactively scaling resources up or down, you can cater to fluctuating traffic demands without compromising performance.
Reduce Costs: Proactive monitoring helps prevent costly downtime and resource wastage. By optimizing resource allocation and identifying areas for cost savings, you can ensure a more cost-effective cloud environment.
The Impact of Cloud Observability on Our Overall Performance
The health of your cloud applications directly impacts your overall business performance. Here's how:
User Experience: Slow loading times, frequent errors, or unexpected crashes can significantly impact user experience. Proactive monitoring ensures smooth application functioning, leading to satisfied and engaged users.
Employee Productivity: When applications are slow or unavailable, employee productivity suffers. Monitoring helps maintain application health, allowing employees to focus on their tasks without disruptions.
Brand Reputation: Downtime or performance issues can damage your brand reputation. Proactive monitoring helps maintain application availability and performance, fostering trust and confidence in your brand.
Revenue Generation: Application downtime translates to lost revenue opportunities. Proactive monitoring safeguards against downtime and ensures your applications are always up and running, ready to serve customers.
By effectively monitoring your cloud applications, you gain valuable insights and control, allowing you to optimize performance, ensure business continuity, and achieve your overall business goals.
Diving into the Top 5 Metrics for Cloud Application Health
Now that we understand the importance of monitoring cloud applications, let's explore the top five critical metrics you should track:
1. Response Time
Response time is a critical metric that directly impacts user experience and satisfaction. It measures the duration between a user request and the corresponding response from the application. By monitoring response time, your organization can identify performance bottlenecks, such as network latency, inefficient code execution, or resource constraints.
Best Practices: Aim for sub-second response times for optimal user experience. Consider implementing caching mechanisms and optimizing backend processes to reduce response times.
Impact on Performance: Slow response times can lead to frustrated users who may abandon tasks or switch to a competitor.
Dashboard Interpretation: Track response times over time and identify any sudden spikes or increases. Investigate the cause of slowdowns and take corrective actions.
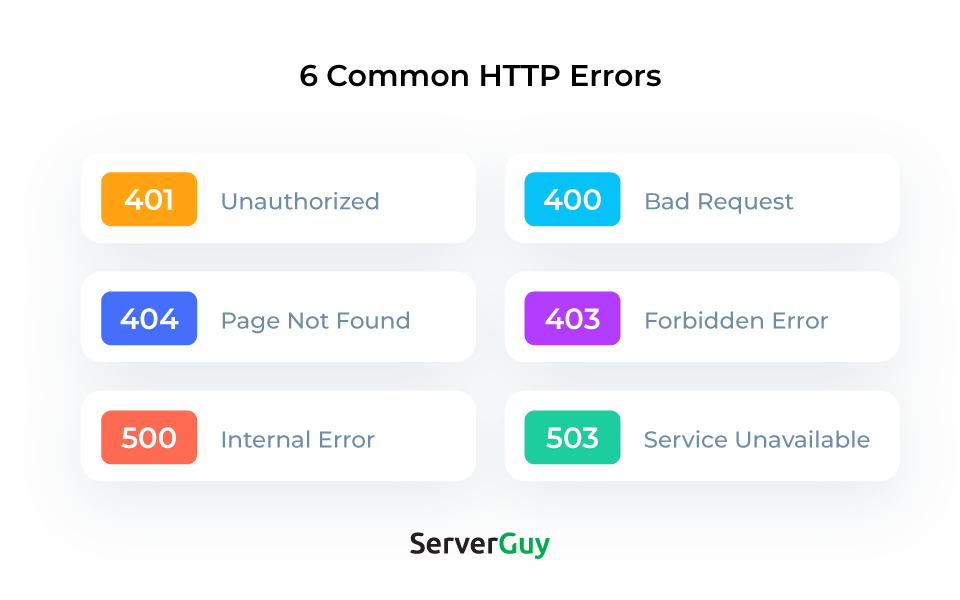
2. Error Rate
Error rates quantify the frequency of errors encountered during application operation, such as HTTP errors, database query failures, or application-specific errors. A healthy application should have a minimal error rate. High error rates can indicate software bugs, compatibility issues, or infrastructure problems that undermine application reliability and functionality.
Best Practices: Strive for a low error rate, ideally below 1%. Implement robust error-handling mechanisms and conduct regular code reviews to minimize errors.
Impact on Performance: High error rates can hinder application functionality and prevent users from completing tasks. They can also damage user trust and confidence.
Dashboard Interpretation: Monitor the types of errors occurring and their frequency. Analyze error logs to identify the root cause and implement bug fixes.
3. Requests Per Minute (RPM)
RPM measures the rate at which the application handles incoming requests. Monitoring RPM metrics allows you to gauge application scalability, identify peak usage periods, and allocate resources accordingly. By scaling infrastructure in response to changes in request volume, you can maintain optimal performance and ensure a seamless user experience during periods of high demand.
Best Practices: Analyze historical data to predict peak traffic periods and proactively scale resources to handle increased load.
Impact on Performance: A sudden surge in RPM can overwhelm the application, leading to slowdowns or crashes. Conversely, low RPM might indicate underutilization of resources.
Dashboard Interpretation: Track RPM alongside response times. Identify any correlations between high RPM and increased response times. This can indicate potential bottlenecks that need optimization.
4. CPU Utilization
CPU utilization refers to the percentage of processing power your application is using. Monitoring CPU utilization helps ensure efficient resource allocation and prevents performance bottlenecks.
Best Practices: Aim for a CPU utilization rate between 30% and 70%. This leaves headroom for handling traffic spikes while avoiding resource waste. Utilize auto-scaling features offered by cloud providers to scale CPU resources dynamically based on demand.
Impact on Performance: High CPU utilization can lead to sluggish application performance and timeouts. Conversely, very low utilization indicates underutilized resources and potential cost inefficiencies.
Dashboard Interpretation: Monitor CPU utilization alongside other metrics like response time and RPM. Identify instances where high CPU usage coincides with performance degradation. This might indicate inefficient application processes that require optimization.
5. Memory Utilization
Memory utilization refers to the percentage of available memory your application is using. Monitoring memory usage helps prevent memory leaks and ensures efficient application execution.
Best Practices: Aim for a memory utilization rate between 20% and 80%. This provides sufficient memory for smooth operation while avoiding overallocation. Consider code optimization techniques and memory leak detection tools to prevent memory-related issues.
Impact on Performance: Memory leaks or insufficient memory can lead to application crashes, slowdowns, and unexpected errors.
Dashboard Interpretation: Track memory utilization alongside CPU usage. Identify situations where both reach high levels simultaneously. This might indicate an application memory leak that requires investigation and patching.
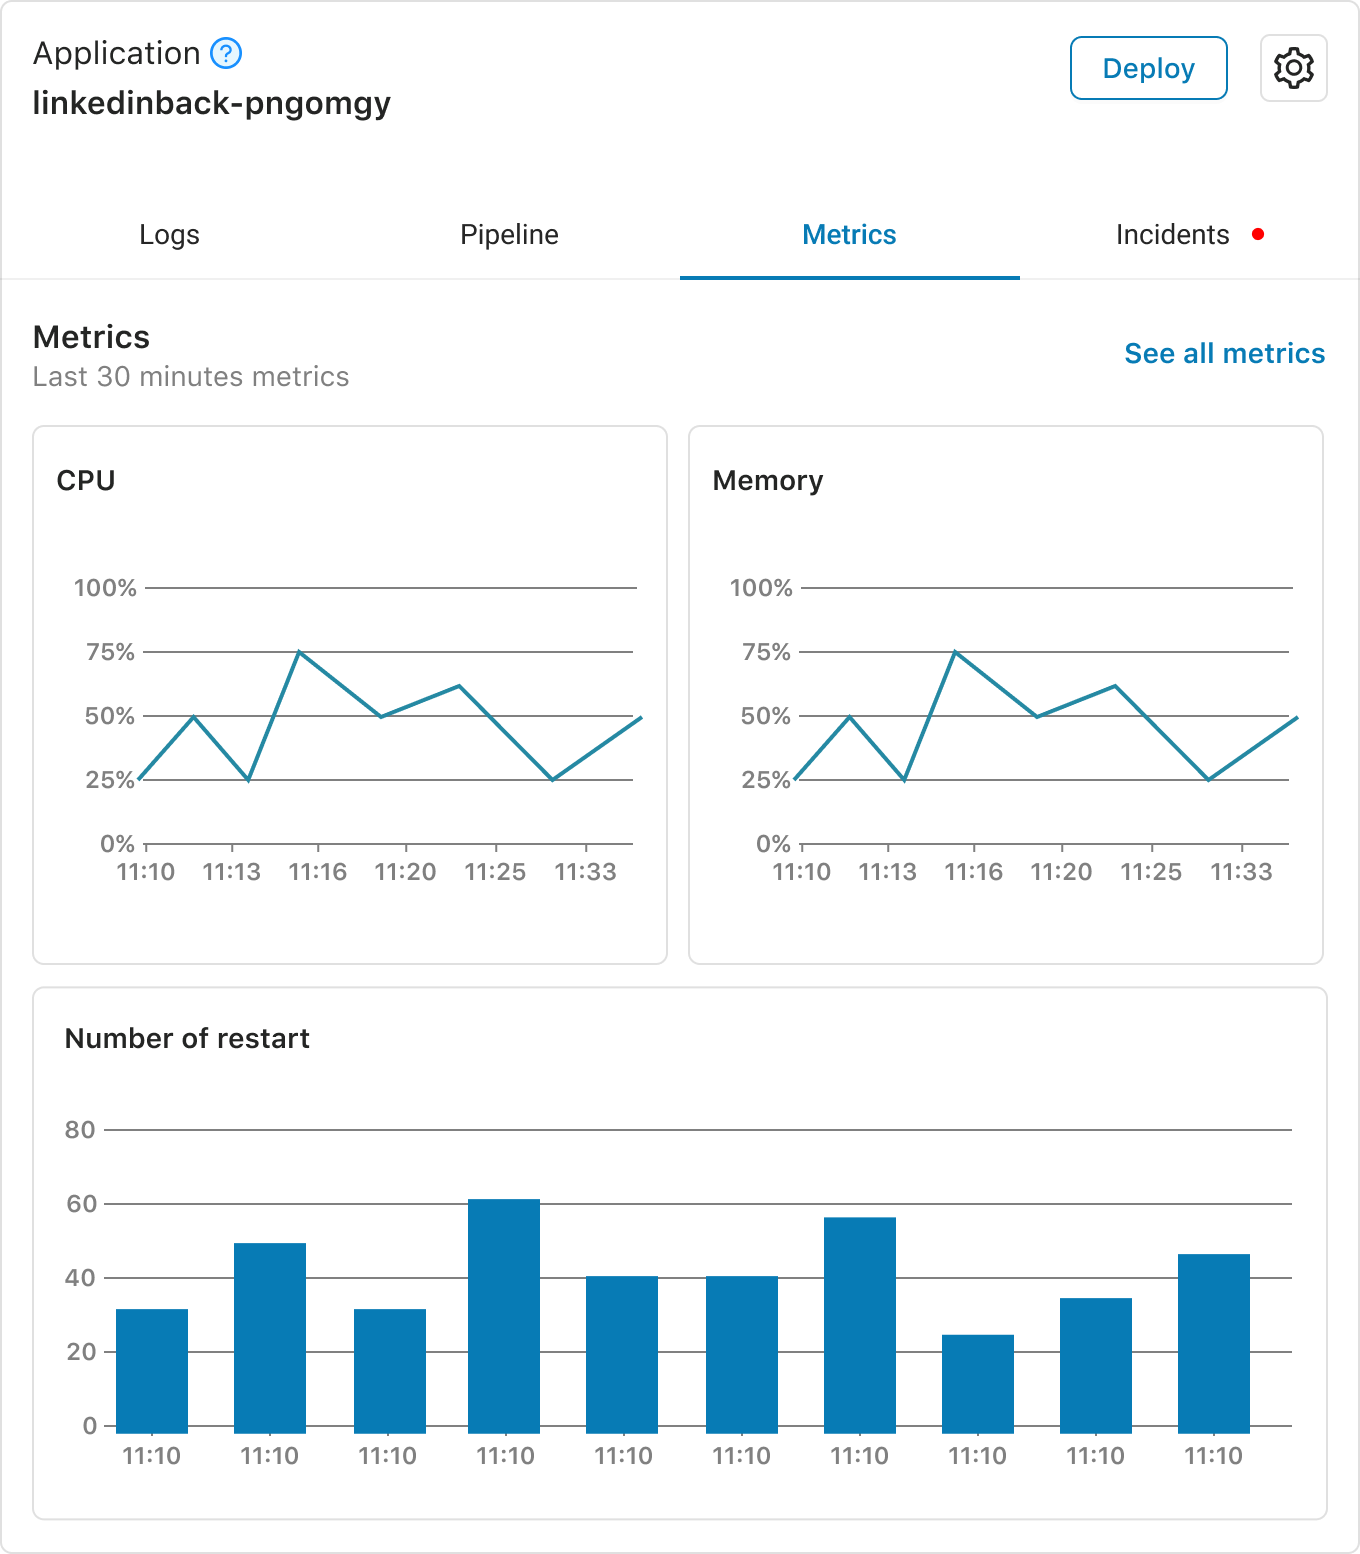
Using Dashboards for Effective Monitoring & Visibility
Cloud monitoring tools provide dashboards that visually represent these key metrics. By creating custom dashboards, you can tailor the information to your specific needs and gain actionable insights. Here are some tips for using dashboards effectively:
Combine Metrics: Don't view metrics in isolation. Combine related metrics like response time and RPM on the same dashboard to identify correlations and pinpoint bottlenecks.
Set Thresholds: Configure alerts for critical metrics that exceed predefined thresholds. This allows for proactive intervention before issues escalate.
Track Trends: Monitor metrics over time to identify trends and predict potential problems. Look for sudden spikes or dips that might indicate underlying issues.
Correlate Events: Investigate incidents by correlating application logs with changes in metrics. This helps identify the root cause of performance issues.
Conclusion
By following these best practices and leveraging the power of cloud application monitoring tools, you can gain a comprehensive understanding of your application's health.
Effective cloud application monitoring is essential for organizations seeking to optimize performance, reliability, and security in the cloud.
By prioritizing key metrics such as response time, availability, CPU utilization, memory utilization, and requests per minute, your team can proactively identify and address issues, optimize resources, and enhance user experience. With comprehensive monitoring practices in place, you can unlock the full potential of cloud computing and drive business success for your company.